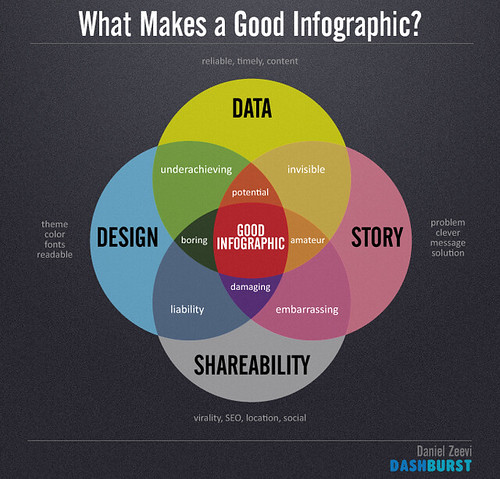
Infographics are visual representations of data.
In the olden days, creating an infographic required a great amount of design skill. But with the wonderful Web 2.0 world, it's as easy as clicking on a few choices and entering your data.
(Graphic from: http://www.flickr.com/photos/dashburst/8448339735/)
Think of all the possibilities for student projects - timelines, graphs representing scientific data, venn diagrams for character comparisions, annotated historical maps, math comparisons of data.
A few sites that help you create infographics:
Infogr.am
Infogram allows you to add more than 30 different types of charts, includes the option to import data from spreadsheets and other files and the final product can be downloaded, embedded in your website and shared with other viewers.
Piktochart
Piktochart has ready to use themes that can be customized for your needs. It has easy to use drag and drop functions, interactive charts and high resolution graphics.
Visually
Visually gives you templates that you can customize. It will pull data from a social media network, including specific hashtags, and create a story.
Dipity
Dipity is primarily a timeline product. You can show the progress of events over a period of time.
Easelly
Easelly lets you create charts easily (easelly?) by clicking and moving your mouse.
For more information about infographics::
10 Fun Tools to Easily Make Your Own Infographics
10 of the Best Tools for Creating Infographics
10 Awesome Free Tools to Make Infographics
To see some great examples of infographics:
40 Useful and Creative Infographics
10 of My Favorite Infographics
Here's an infographic I created about a typical day in the ECISD Libraries created using info.gram.
Check out this tutorial for making an infographic using easel.ly and info.gram:
Creating infographics | screencast tutorial from
School Library Journal on
Vimeo.